
Play & recreation
Where youth spend leisure time, what draws them out, and what prevents participation.
YOUTH INSIGHT • SPATIAL STORYTELLING • ACTIONABLE DATA
The Action Mapping Project works with youth to transform lived experience into actionable spatial insight. We help schools, parks, cities, transit agencies, and regional partners understand the everyday lives of youth. And we work closely with those partners to integrate AMP Insight into their existing placemaking and decision-making systems.

WHAT CONVENTIONAL DATA MISSES
Conventional GIS data are useful for mapping the locations of parks, trails, bus stops, schools, or neighborhood boundaries. Those data generally do not adequately detail the lived experience of those places. Where, for example are youth feeling uneasy? Are there particular trails that youth feel most safe on bicycles? How do youth experience a set of 30 parks differently? What programming would be most likely to encourage kids to play more at their local park?
HOW AMP WORKS
AMP begins with lived experience and ends with decisions partners can use. Click through the process to see how a story becomes spatial insight.
LISTEN
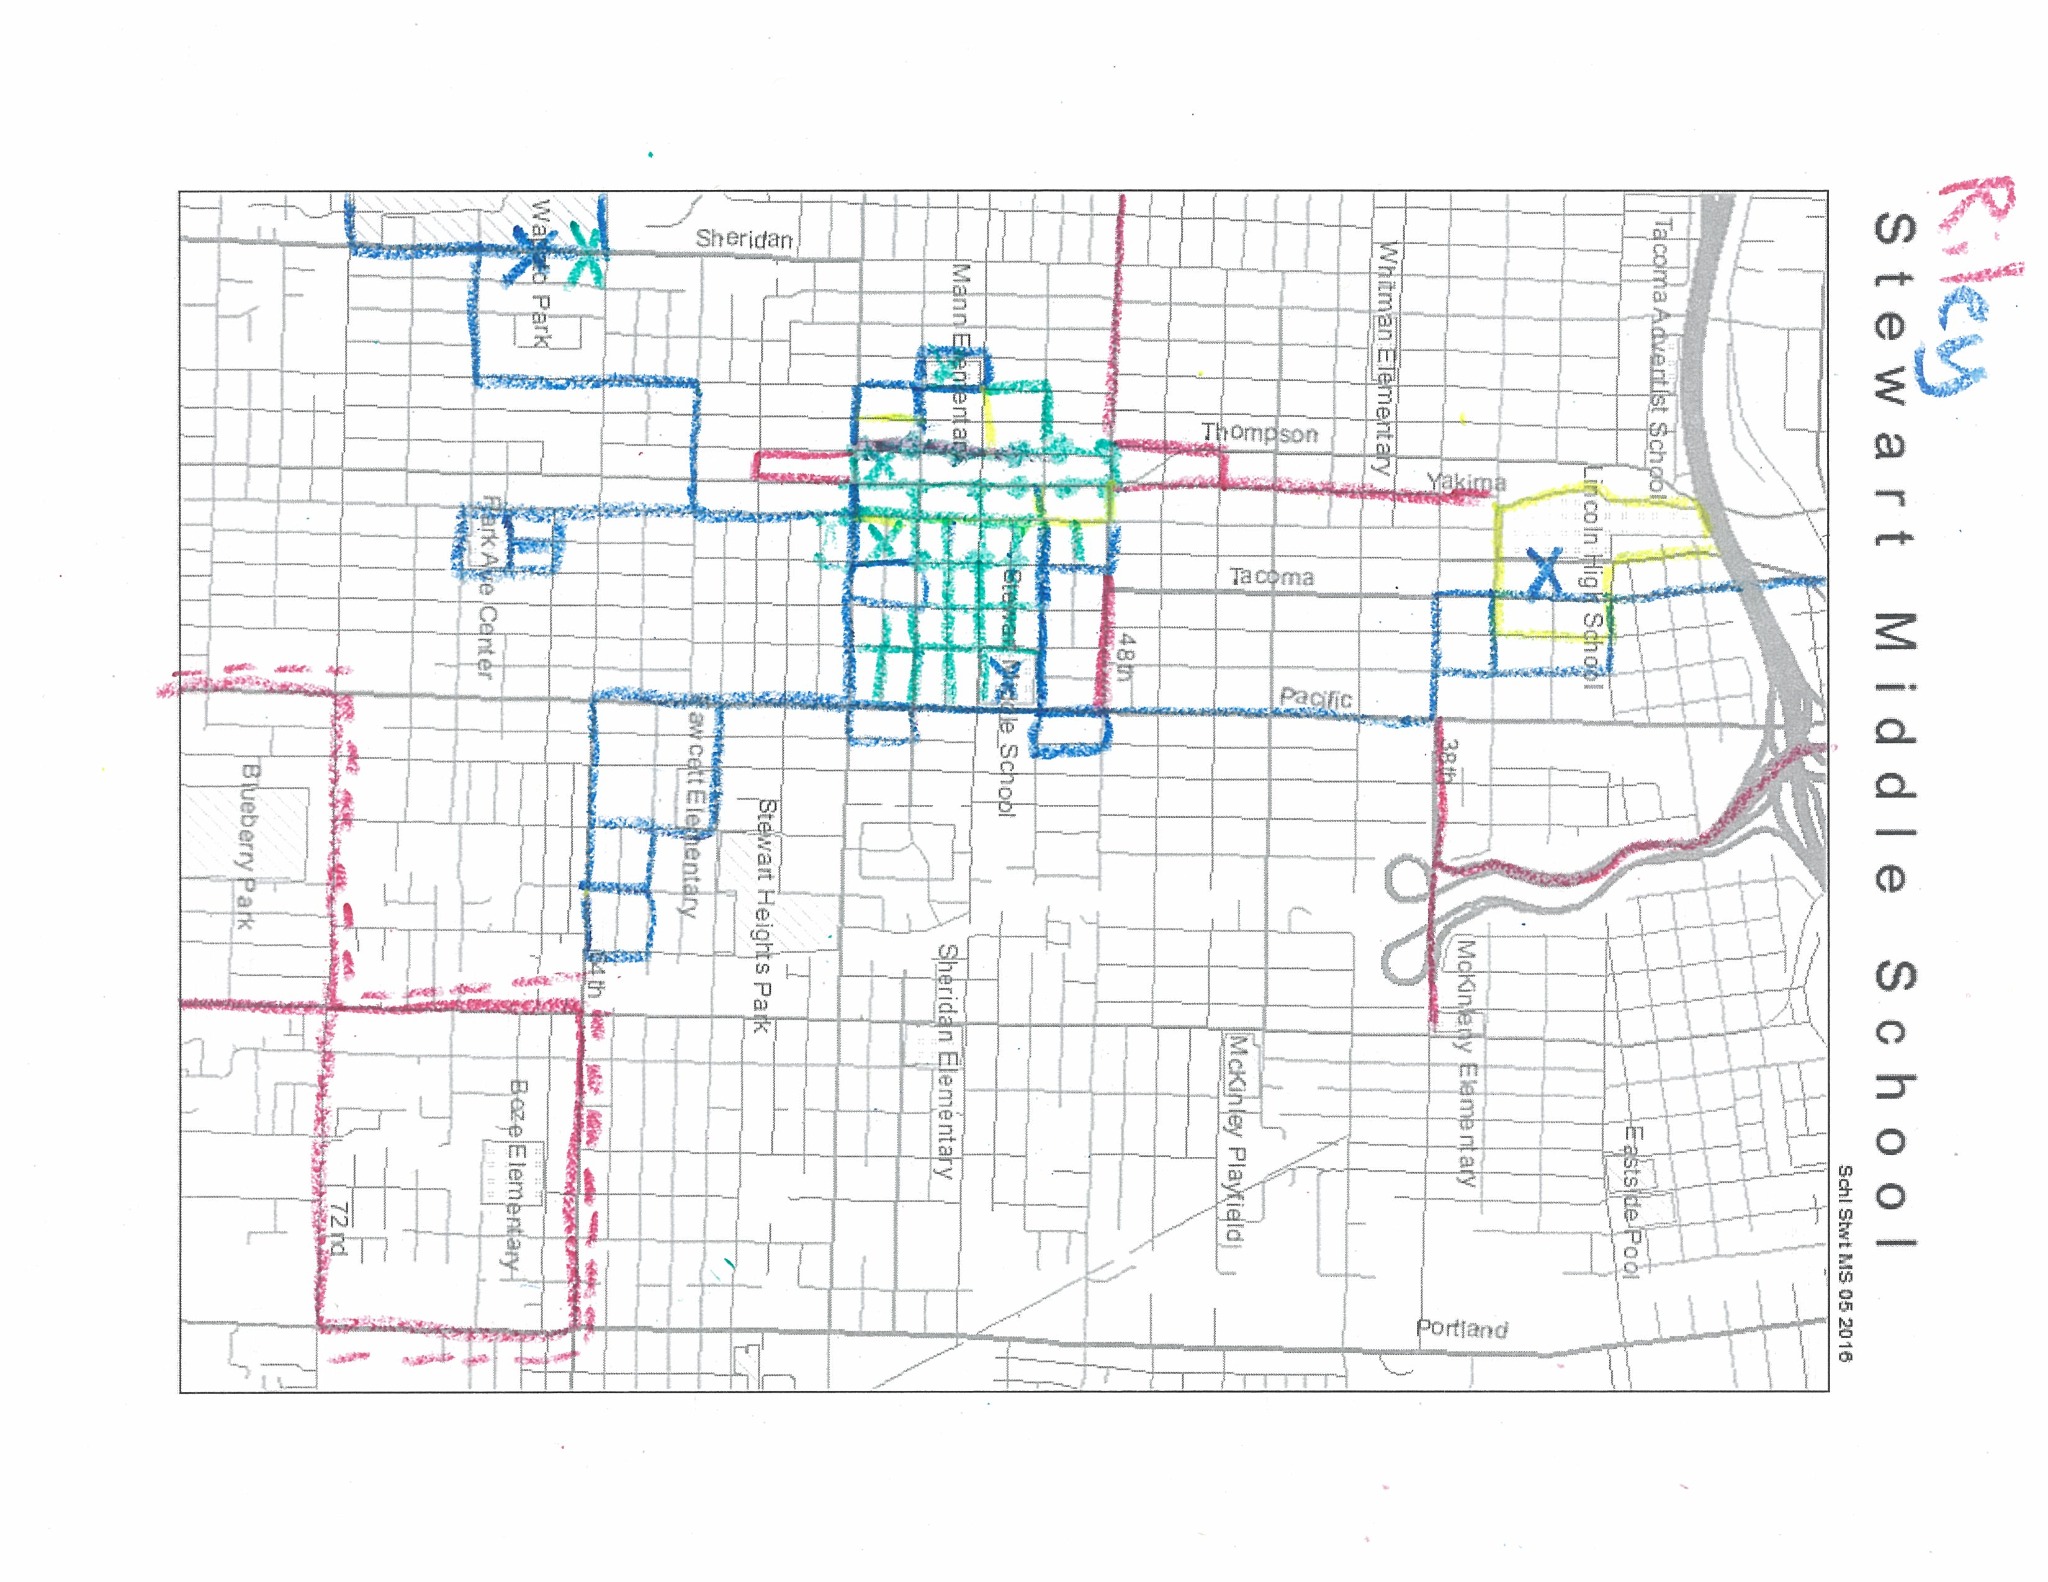
AMP curriculum invites young people to reflect on the places they use, avoid, love, struggle with, and want to change.
CURRENT PROCESS
Our participants share lived experience by drawing on the Action Map. They're mapping things like the active transportation routes they prefer, places they feel unsafe, the areas where they feel most like they belong, locations of significant features in their neighborhoods, etc. And with every object they map, they're sharing stories of what happened there, why they feel unsafe, what they love about the route, etc.
We transform their stories into actionable insight in the form of AMP Indicators that we share with our partners so that they can incorporate youth voice into the placemaking, planning, and decision-making processes.
SEE THE TRANSFORMATION
This is AMP: thousands of unique stories of lived experience transformed to actionable insight.
AMP IN ACTION
What happens when thousands of young people map how they experience their community?
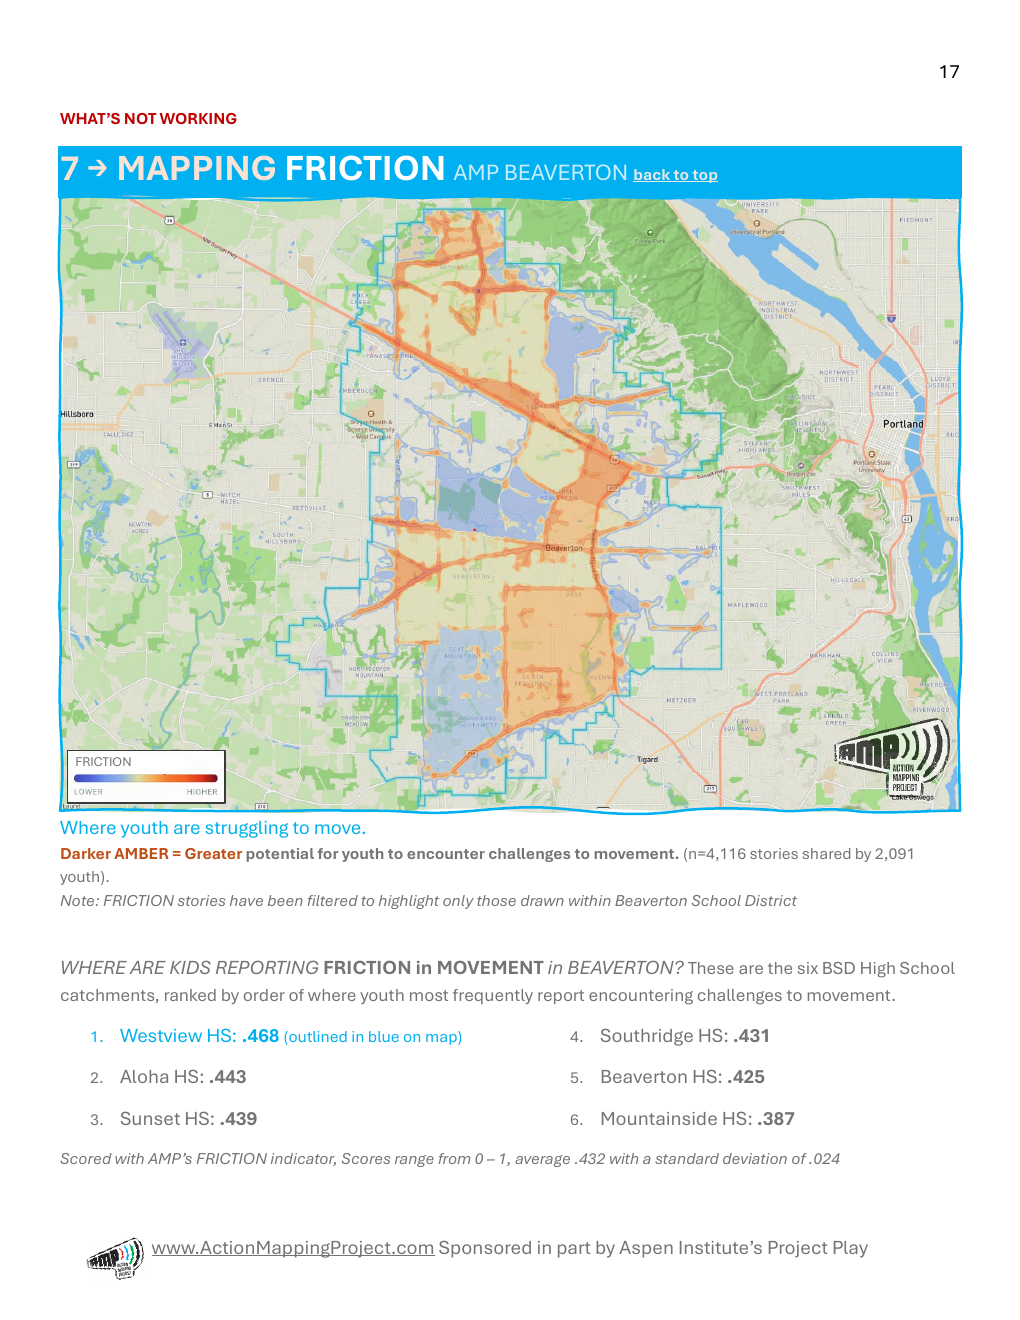
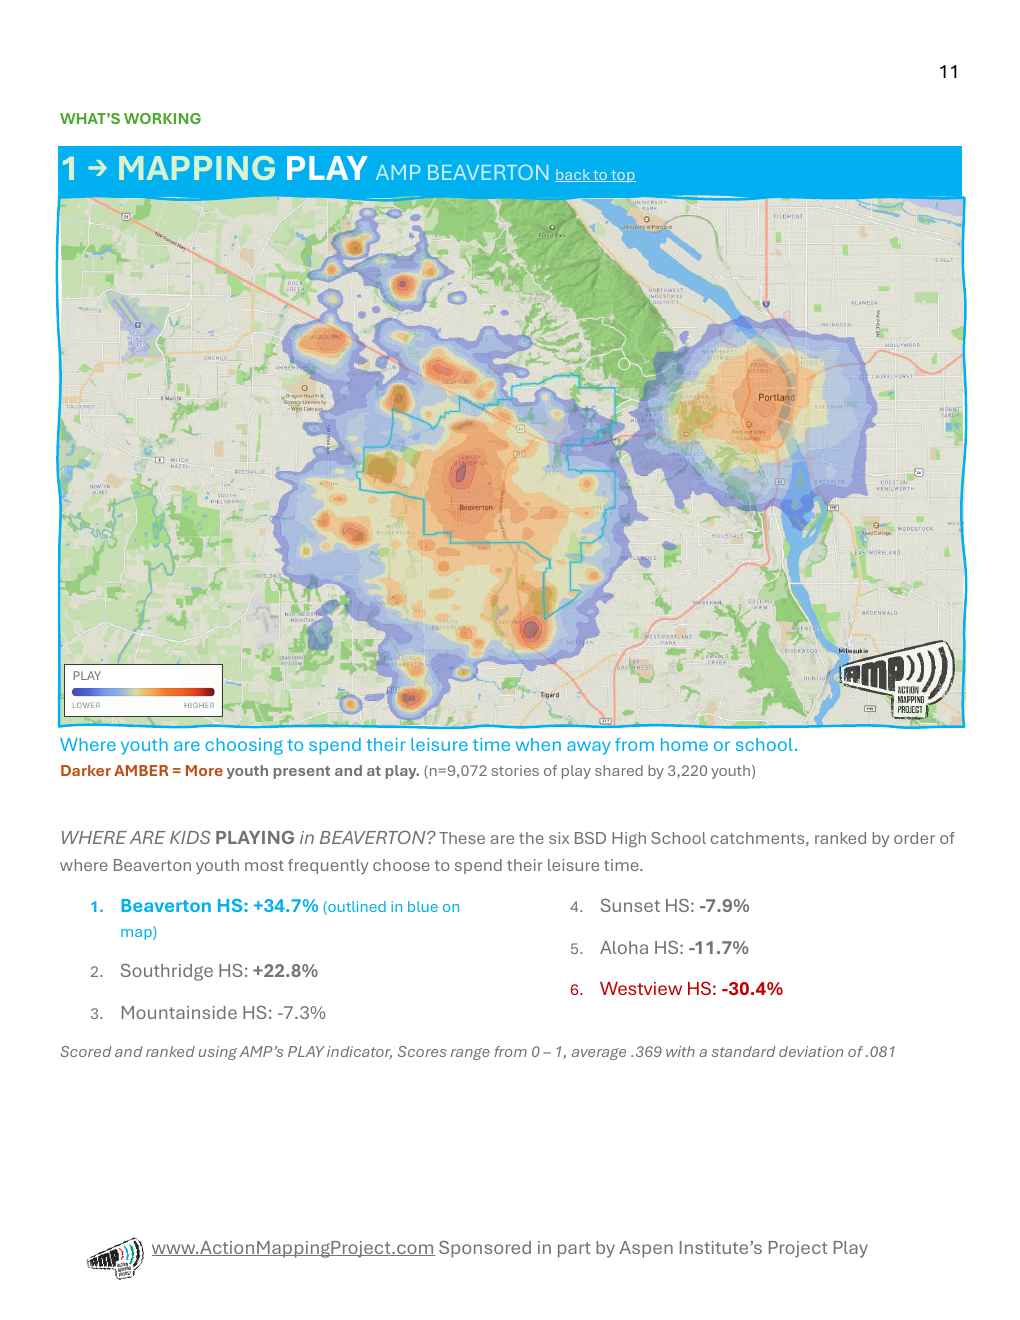
In Beaverton, 4,471 youth shared nearly 50,000 spatial stories about play, mobility, belonging, safety, and everyday life. AMP transformed those stories into indicators, maps, comparisons, and practical opportunities for action.
WHAT PARTNERS LEARN
Where youth spend leisure time, what draws them out, and what prevents participation.

Routes used, routes avoided, barriers to movement, and opportunities to improve access.

Where youth feel at ease, where they feel unsafe, and how place conditions shape comfort and connection.

How insight can support programming, park investment, mobility planning, placemaking, and evaluation.
SEE WHAT AMP PRODUCES
Maps, quotes, qualitative themes, word clouds, and place-specific opportunities.
Open PDF4,471 youth and nearly 50,000 stories translated into a map book, field guide, indicators, and strategies.
Explore project →Friction indicators identify the geography of barriers to walking, biking, scootering, and rolling.
AMP insight can be delivered alongside rider, GIS, and secondary data inside partner technology systems.
Open overviewNeighborhood and domain analytics help public-serving agencies identify resource gaps and compare areas.
Open overviewAMP curriculum creates a structured way for youth to reflect, map, discuss, and explain their everyday experience.
APPLICATIONS OF AMP INSIGHT
AMP insight can be applied wherever organizations need a more human understanding of place.
Play, belonging, programming, access, and park-specific opportunities.
Movement, friction, active transportation, access, corridors, routes, and stops.
Persistent youth experience embedded in school, neighborhood, and public-planning conversations.

Community experience layered into regional planning, services, resources, and neighborhood analytics.
TECHNOLOGY PARTNER
We use StoryTeller to support our spatial surveys, interactive mapping, persistent spatial data, longitudinal indicators, dashboards, and Insight Systems.
Community relationships, curriculum, youth engagement, research design, indicator development, analysis, interpretation, and recommendations.
Custom spatial survey technology, spatial data infrastructure, interactive hubs, persistent analytics, and system delivery.

OUR ETHIC
Community members are experts in their own lives. AMP creates ways for those experiences to remain visible after a workshop, survey, planning process, or public meeting ends.
LET'S BUILD SOMETHING USEFUL
Tell us the decision you are trying to make. We will help identify what lived experience could make visible.